

1.8 Sigma
Every post-ETF Bitcoin correction has stopped at the same volatility boundary. This one just did.

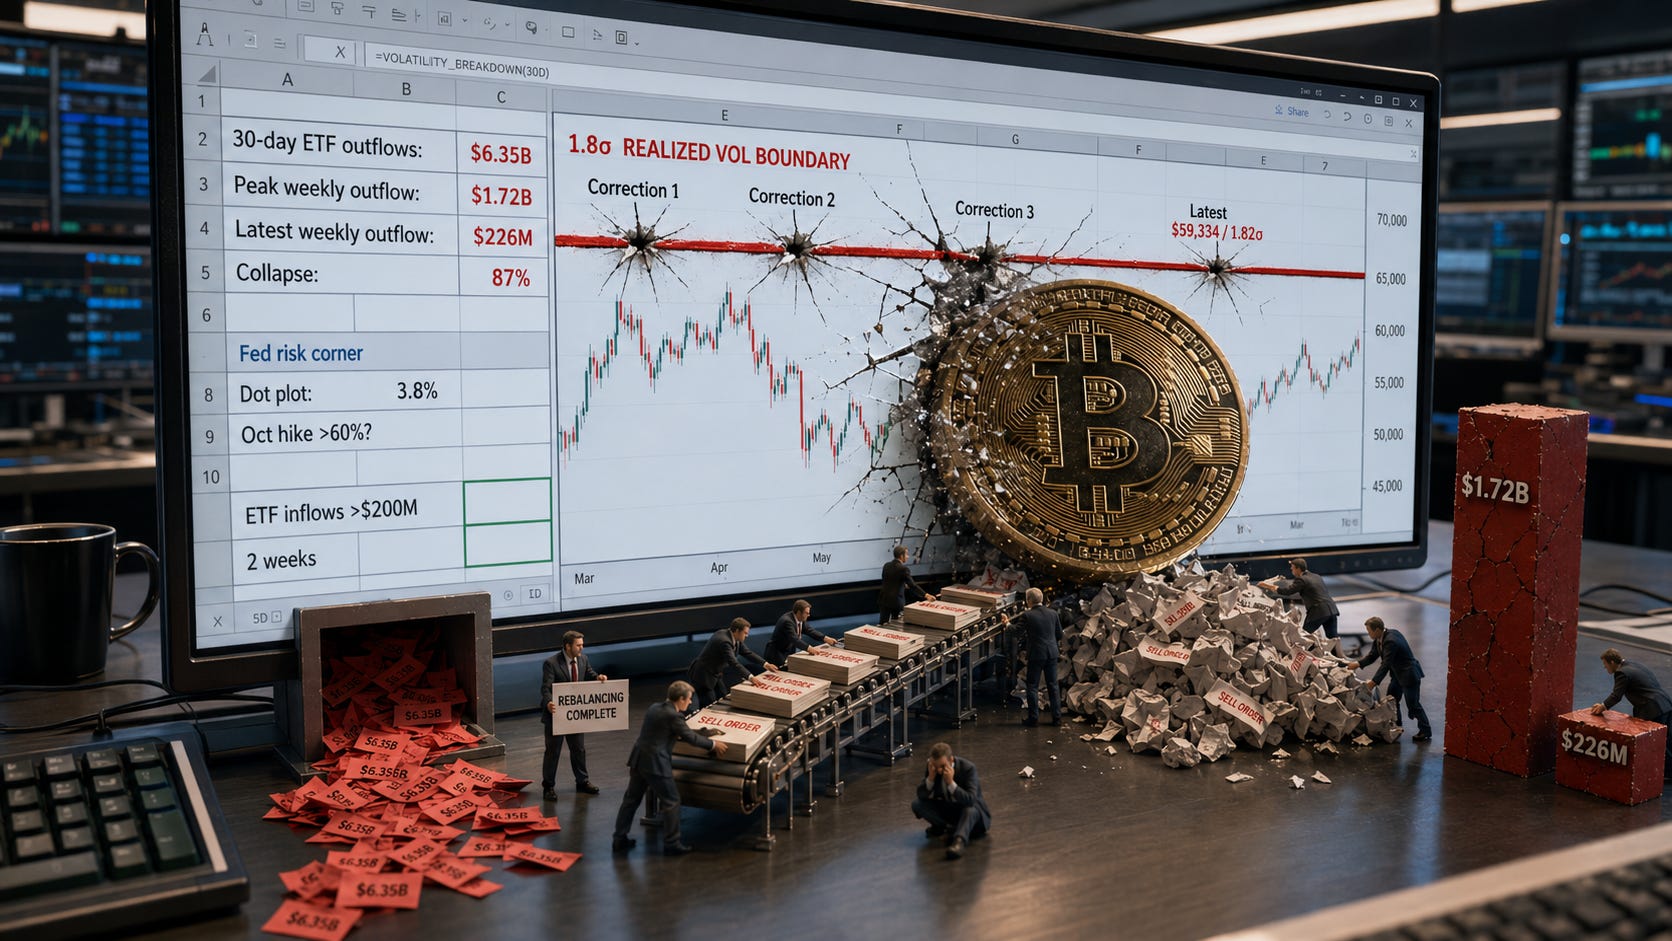
The spreadsheet is eleven columns wide and it updates every six hours. It runs on a server in Weehawken, New Jersey, fourteen minutes by train from midtown Manhattan, and it feeds a single number to the risk dashboard of one of the five custodians that between them hold more than 80 percent of all spot Bitcoin ETF assets in the United States. The number has no name. Internally, the team calls it “the sigma count,” and it measures how many standard deviations the current spot price of Bitcoin sits below the trailing 90-day local high, calibrated against the asset’s own 90-day realized volatility.
On the morning of June 25, when Bitcoin printed $59,334 on Coinbase at 12:37 PM Eastern, the sigma count on the spreadsheet read 1.82.
The number matters because it has been right before. In the nearly thirty months since the SEC approved the first US spot Bitcoin ETFs in January 2024, Bitcoin has experienced four corrections that exceeded 20 percent from a local high. Every one of them terminated within a band of 1.7 to 1.9 standard deviations of 90-day realized volatility.
The band is not a guarantee and it is not a floor. It is the point at which the specific type of selling that drives post-ETF corrections, institutional rebalancing within mandated allocation bands, mechanically exhausts itself. The spreadsheet does not predict. It measures.
And what it measured last week was a correction that had arrived at the boundary.
The thesis is specific and falsifiable: Bitcoin’s decline from its spring high near $77,600 to its low near $59,300 on June 25 represents a drawdown of approximately 23.5 percent, which lands at 1.8 standard deviations of the asset’s trailing 90-day realized volatility. This is not a coincidence. It is the signature of ETF-era selling mechanics, where the dominant sellers are not retail panic or organic liquidation but pension funds, endowments, and wealth management platforms rebalancing portfolios against allocation bands that trigger automatically when Bitcoin’s weighting drifts beyond a predefined ceiling.
That selling is finite by construction. When the rebalancing is complete, the selling stops. It does not taper. It stops.
The evidence arrived in the ETF flow data. US spot Bitcoin ETFs recorded $6.35 billion in net outflows over the 30 trading days through late June, according to Galaxy Research, the largest 30-day decline since the products began trading in January 2024. Cumulative net flows fell to $53.4 billion from a $63 billion peak in October 2025. The 13-day consecutive outflow streak from mid-May to early June, during which $4.33 billion exited the funds (roughly 59,400 Bitcoin), was the longest unbroken streak of redemptions in the ETF complex’s history.
But the number that tells the real story is 87. That is the percentage by which weekly ETF outflows declined from their early-June peak to the final week of the month, according to Farside Investors data. Weekly outflows fell from $1.72 billion in the week ending June 5 to approximately $226 million by the last full week of June. The selling did not taper gradually. It collapsed.
That pattern, an abrupt deceleration rather than a slow fade, is the hallmark of mechanical rebalancing reaching its terminal point. Organic selling, the kind driven by sentiment, by fear, by genuine conviction that the asset is impaired, builds momentum. Mechanical selling runs out of inventory.
The woman who runs digital asset risk at one of the three largest Bitcoin ETF custodians has a phrase for it. She calls it “the compliance cliff,” the moment when every portfolio that needed to rebalance has rebalanced, every allocation band that was breached has been brought back within tolerance, and the marginal seller disappears from the order book not because sentiment has changed but because the process is complete. She has seen it four times now. She says the fourth time was louder than the others, $6.35 billion louder, but the shape was identical.
The volatility data confirmed the pattern from a different angle. Bitcoin’s one-week realized volatility fell to roughly 17 percent annualized as of early June, according to data tracked by Volmex Finance, the lowest weekly reading in more than two years. The Bollinger Bands on the daily chart compressed to less than $3,500 between upper and lower bands, the tightest configuration since the squeeze in late July 2025 that preceded a three-month expansion, with prices swinging from $100,000 to the all-time high above $126,000 set on October 6, 2025, according to CoinMarketCap data.
The distinction between volatility compression and price stagnation is the distinction between a coiled spring and a dead battery. A dead battery does nothing because it has nothing to give. A coiled spring does nothing because it is waiting.
The Bollinger Band width at its current level has, in every prior instance in Bitcoin’s post-ETF history, resolved with a move of at least 40 percent within 100 days, according to historical analysis published by CryptoDailyUK in May 2026. The direction of that move is not predetermined. But the magnitude is historically consistent.
Here the picture gets complicated. The Federal Reserve’s June 17 meeting, Kevin Warsh’s first as chair, ended with rates unchanged at 3.5 to 3.75 percent and a set of dot-plot projections that removed the prior bias toward cuts and replaced it with the possibility of a hike as early as October. The median projection for the federal funds rate at year-end shifted to 3.8 percent, up from 3.4 percent in the March summary of economic projections. The inflation forecast rose to 3.6 percent headline and 3.3 percent core.
The risk manager at the custodian sees the tension. The sigma count says the mechanical selling is done. The Fed says the cost of holding a zero-yield asset just became more uncertain, not less. She has the historical pattern on one screen and the updated dot plot on the other, and they are telling her two different things. The compression is real. The expansion is coming. But the direction of the expansion depends on whether the macro environment permits the recovery that the volatility math implies.
The options market has placed its bet. The July 31 $80,000 call on Deribit holds 7,118.9 Bitcoin in open interest, making it one of the most active strikes on the platform, according to The Block’s options data. The put-to-call ratio across the Bitcoin options complex stands at 0.83, reflecting a market that is, on balance, positioned for appreciation. But the conviction behind that positioning has thinned: total Bitcoin options open interest has fallen to roughly $35 billion from a peak above $65 billion in October 2025.
The June 26 quarterly settlement on Deribit, the largest of 2026, delivered a verdict of its own. Approximately 80 percent of all Bitcoin options that settled on that date expired out of the money, according to Deribit data. The max pain level sat near $72,000, more than $11,000 above the spot price at settlement. Four in five positions were wrong about where Bitcoin would be. The quarterly expiry wiped the slate. The new positioning, concentrated in July and September expiries, reflects a market that has absorbed the drawdown and is pricing the next move, not the one that just happened.
The accumulation data tells the same story from the other side of the trade. During the same window in which ETFs recorded their record outflows, long-term holder supply flows ran roughly ten times larger in magnitude and pointed the opposite way, toward net buying, according to analysis cited by Investing.com. The headline was institutional selling. The undercurrent was patient accumulation at lower prices by holders who do not operate within the same allocation-band constraints that forced the ETF rebalancing. The Binance long-short ratio showed 67.4 percent long versus 32.6 percent short, per CoinStats data from June 24, reflecting a retail crowd positioned for upside that contrasts sharply with the institutional behaviour of the prior month.
If you hold Bitcoin and you are watching the volatility compression, the most likely path forward is the one the compression signature has delivered every time before. The spring uncoils. The Bollinger Bands expand. The move begins. At roughly 45 percent probability, the mechanical selling has exhausted itself, the macro does not worsen materially over the next 60 days, and the combination of long-term holder accumulation, options repositioning into July and September, and the removal of the quarterly options overhang produces a recovery toward the $72,000 to $78,000 range by early September. The 200-week moving average near $62,457 holds as the structural floor it has been in every prior cycle. You do not need a catalyst. You need the absence of a new seller. The compliance cliff means the old sellers are finished.
The path that demands your patience, at 30 percent, is the one where the compression resolves sideways rather than upward. The Fed’s hawkish pivot raises the carry cost of holding Bitcoin in institutional portfolios. The CLARITY Act stalls in the Senate. No new buyer class emerges to replace the ETF flows that have turned negative year-to-date. Bitcoin trades in a $57,000 to $65,000 range through the summer, volatility stays suppressed, and the expansion that the Bollinger Bands promise simply takes longer than the historical pattern suggests. The 200-week moving average holds, but the recovery is a grind, not a launch.
The scenario that should concern you, at 25 percent, is the one where the macro breaks the pattern. The Fed hikes in October. Treasury yields at the long end rise further. The same institutional rebalancing that just finished selling Bitcoin to bring allocations back within band begins a second round as rising rates shift the efficient frontier against all volatile assets. In this world, the sigma count resets. The correction extends beyond 1.8 standard deviations for the first time in the post-ETF era, the $57,000 level that has held as approximate support gives way, and Bitcoin retests $50,000, which technical analysts have identified as the next significant downside reference. The compression resolves. It resolves down.
What shifts these probabilities is not price action. It is the Fed. An October hike reprices the entire volatility surface and pushes probability mass from the recovery scenario toward the macro-break scenario. A hold, or any signal that Warsh’s committee is content to wait, does the opposite. The second variable is ETF flows: a return to sustained net inflows for three or more consecutive weeks would confirm that the rebalancing is finished and new allocative demand is arriving. The third is the CLARITY Act’s path through the Senate, which determines whether the regulatory framework that institutional allocators need to increase, rather than merely maintain, their Bitcoin exposure will exist by year-end.
Watch the weekly ETF flow data from Farside Investors through mid-July. Two consecutive weeks of net inflows above $200 million would confirm the compliance cliff is behind the market. One week of outflows exceeding $500 million would suggest the rebalancing is not finished and the thesis needs revision.
Watch the CME Bitcoin futures basis through the July contract. A widening basis above 5 percent annualised would signal that institutional demand is returning to the derivatives market ahead of spot. A flattening or inversion below 2 percent would signal the opposite.
Watch the Bollinger Band width on the daily chart through the first week of July. The current reading is the tightest since July 2025. The last time it was this tight, the expansion that followed moved price 26 percent in three weeks. The direction is not predetermined, but the magnitude is historically consistent.
Watch the September 16 to 17 FOMC meeting, where the next dot-plot revision will either confirm or reverse the hawkish shift from June. If the October hike probability rises above 60 percent on the CME FedWatch tool before that meeting, the macro-break scenario gains probability mass at the expense of the recovery.
The risk manager at the custodian will be watching the same numbers from her desk in lower Manhattan. She told a colleague last week that the hardest part of her job is not building the model. The model is straightforward: 90-day rolling standard deviation, trailing local high, current drawdown, one division. The hard part is trusting the answer when everything else in the room is loud. The Fed is loud. The outflow headlines are loud. The senators debating the CLARITY Act are loud. The spreadsheet in Weehawken is quiet.
The question for the next 60 days is not whether the math was right about the boundary. The math has been right four times, and four is not a large sample, but it is the only sample the ETF era has produced.
The question is whether the ETF era itself is changing the rules that produced the boundary. Institutional rebalancing was a novel force in January 2024. By mid-2026, it has become the dominant price-setting mechanism, accounting for the majority of selling volume during drawdowns. The sigma count measures a world in which institutions sell at predictable intervals for predictable reasons and then stop.
If the intervals change, if the reasons multiply, if the Fed makes holding Bitcoin structurally more expensive in a way that triggers a new category of selling, then the boundary moves. The number at the bottom of page two would still be accurate. It would just be measuring a different market.
ANNEX: WHAT THE SIGMA COUNT MEANS FOR YOUR NEXT SIXTY DAYS
Bitcoin’s post-ETF correction has reached the 1.8-sigma boundary that terminated every prior drawdown in this era. The three scenarios below sum to 100 percent and describe mutually exclusive paths forward.
Compression Resolves Upward: 45%
If you are positioned for recovery, this is the scenario where the volatility math pays. The Bollinger Bands expand upward, the 87 percent collapse in weekly ETF outflows proves to be the compliance cliff rather than a temporary pause, and long-term holder accumulation combines with fresh options positioning in July and September expiries to produce a grind toward the $72,000 to $78,000 range by early September. The 200-week moving average near $62,457 holds as the floor. Your risk is being early, because the compression may take another two to three weeks to fully resolve, and the intervening noise from FOMC commentary and weekly ETF flow reports will test your conviction before the expansion begins.
Tracking variable: Farside Investors weekly ETF flow data. At 30 days, the probability that cumulative net inflows have turned positive for three consecutive weeks is approximately 40 percent. At 90 days, approximately 60 percent. At 12 months, approximately 75 percent. A failure to produce three consecutive positive weeks by mid-September would weaken this scenario materially.
Compression Resolves Sideways: 30%
If you are waiting for a clear signal before adding exposure, this is the scenario that demands patience. The Fed’s hawkish stance raises the implicit cost of holding a volatile, zero-yield asset in institutional portfolios. No new buyer class emerges to replace the ETF flows that have turned year-to-date negative, with cumulative net flows at $53.4 billion versus the October 2025 peak of $63 billion according to Galaxy Research. Bitcoin trades in a $57,000 to $65,000 range through the summer, unable to break above the 200-week moving average with conviction. Your capital is not at risk of a sharp drawdown, but the opportunity cost accumulates as AI equities and Treasury bills offer returns that Bitcoin in a sideways range does not.
Tracking variable: Bitcoin 30-day annualized volatility via The Block’s data dashboard. At 30 days, the probability that 30-day realised volatility remains below 30 percent annualized is approximately 55 percent if this scenario materialises. At 90 days, approximately 40 percent, as the compression cannot persist indefinitely. A breakout of 30-day vol above 45 percent would signal the transition to either the upward or the downward resolution.
Macro Breaks the Pattern: 25%
If you are hedging against the possibility that the ETF era is rewriting its own rules, this is the scenario that reprices everything. The Fed hikes in October. Treasury yields at the long end push above 5 percent. Institutional rebalancing, which the sigma count models as a finite process, becomes a recurring process as rising rates shift the efficient frontier against all volatile assets. The 1.8-sigma boundary that held four times does not hold a fifth. Bitcoin retests $50,000, the next significant technical reference identified by analysts. Your exposure here is not just price risk but model risk: the possibility that the pattern you are relying on has been invalidated by a structural change in the rate environment.
Tracking variable: CME FedWatch implied probability of a rate hike at the October 28 to 29 FOMC meeting. At 30 days, the probability that the implied hike probability exceeds 50 percent is approximately 30 percent. At 90 days, approximately 45 percent if inflation prints continue to surprise upward. If the implied hike probability exceeds 60 percent at any point before the meeting, repricing across the Bitcoin volatility surface is likely and this scenario gains probability mass from both alternatives.
Sources:
Galaxy Research, “Bitcoin ETF Flows: 30-Day Rolling Analysis,” June 2026.
Farside Investors, daily ETF flow data, May and June 2026.
Volmex Finance, realised volatility indices, June 2026.
CoinMarketCap, Bitcoin spot price and historical data, June 2026.
The Block, “30-Day Annualized BTC Volatility” and “Deribit BTC Option Open Interest by Expiry,” June 2026.
Deribit, quarterly options settlement data, June 26, 2026.
Federal Reserve, “FOMC Statement,” June 17, 2026.
Federal Reserve, “Summary of Economic Projections,” June 17, 2026.
CryptoDailyUK, “Bitcoin Volatility Compression: Why Quiet Markets Can Break Suddenly,” May 2026.
Investing.com, “Bitcoin’s $3.4 Billion ETF Bleed Looks More Cyclical Than Structural,” June 2026.
CoinStats, Bitcoin market analysis and long-short ratio data, June 24, 2026.
V-Lab, NYU Stern, “Bitcoin GARCH Volatility Analysis,” June 2026.
SpotedCrypto, “Bitcoin 200WMA: Bear Bottom Signal or 2022 Repeat?” June 2026.
Disclaimer: This report is published by Scenarica Intelligence for informational purposes only. It does not constitute investment advice, a solicitation to buy or sell any financial instrument, or a recommendation regarding any particular investment strategy. Scenarica Intelligence is not a registered investment adviser or broker-dealer. All scenario probabilities and assessments represent the analytical judgment of Scenarica Intelligence and are subject to change without notice. Past performance of any asset or strategy discussed does not guarantee future results. Readers should conduct their own due diligence and consult with qualified financial advisers before making investment decisions.
Scenarica Premium: The full Scenarica suite includes Geopolitics, Economy, Bitcoin, AI, and Sunday Edition.
Scenarica Intelligence
We don’t predict the future. We price it.