



The place where American Bitcoin actually changes hands is a sixty-second window at the end of the New York trading day.
Between 3:59 and 4:00 in the afternoon, the spot exchange-traded funds strike their net asset value and the day’s creations and redemptions settle against that print. A BlackRock iShares Bitcoin Trust creation unit is forty thousand shares, running at roughly twenty-two to twenty-three bitcoin per basket.
Whatever the day’s net demand turned out to be, it resolves there, in a window with a clock on it. Not on a perpetual futures venue at three in the morning offering fifty times leverage to a man in another time zone. A scheduled window, on a business day, in New York.
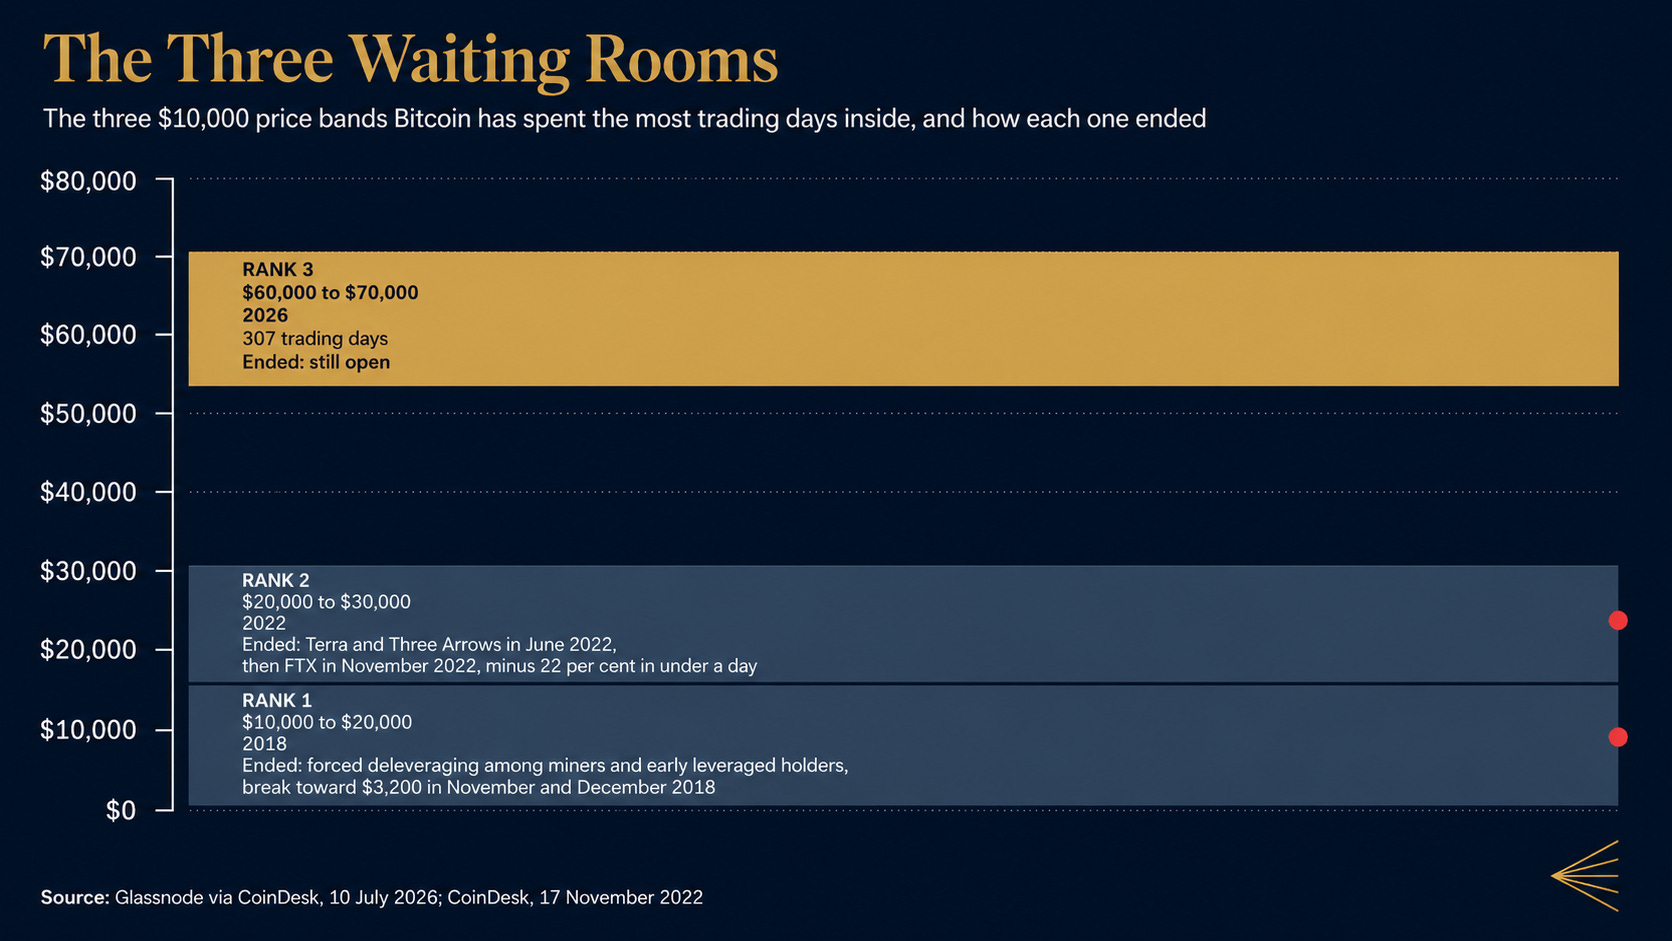
Now the price. Bitcoin spent late July around $65,000, roughly 48 per cent below the $126,198 it printed on 6 October last year. Glassnode counts 307 trading days spent inside the $60,000 to $70,000 band across Bitcoin’s entire history, the third-most of any ten-thousand-dollar tranche, behind only $10,000 to $20,000 in 2018 and $20,000 to $30,000 in 2022. Those two are the great bear-market waiting rooms, and this is the third.
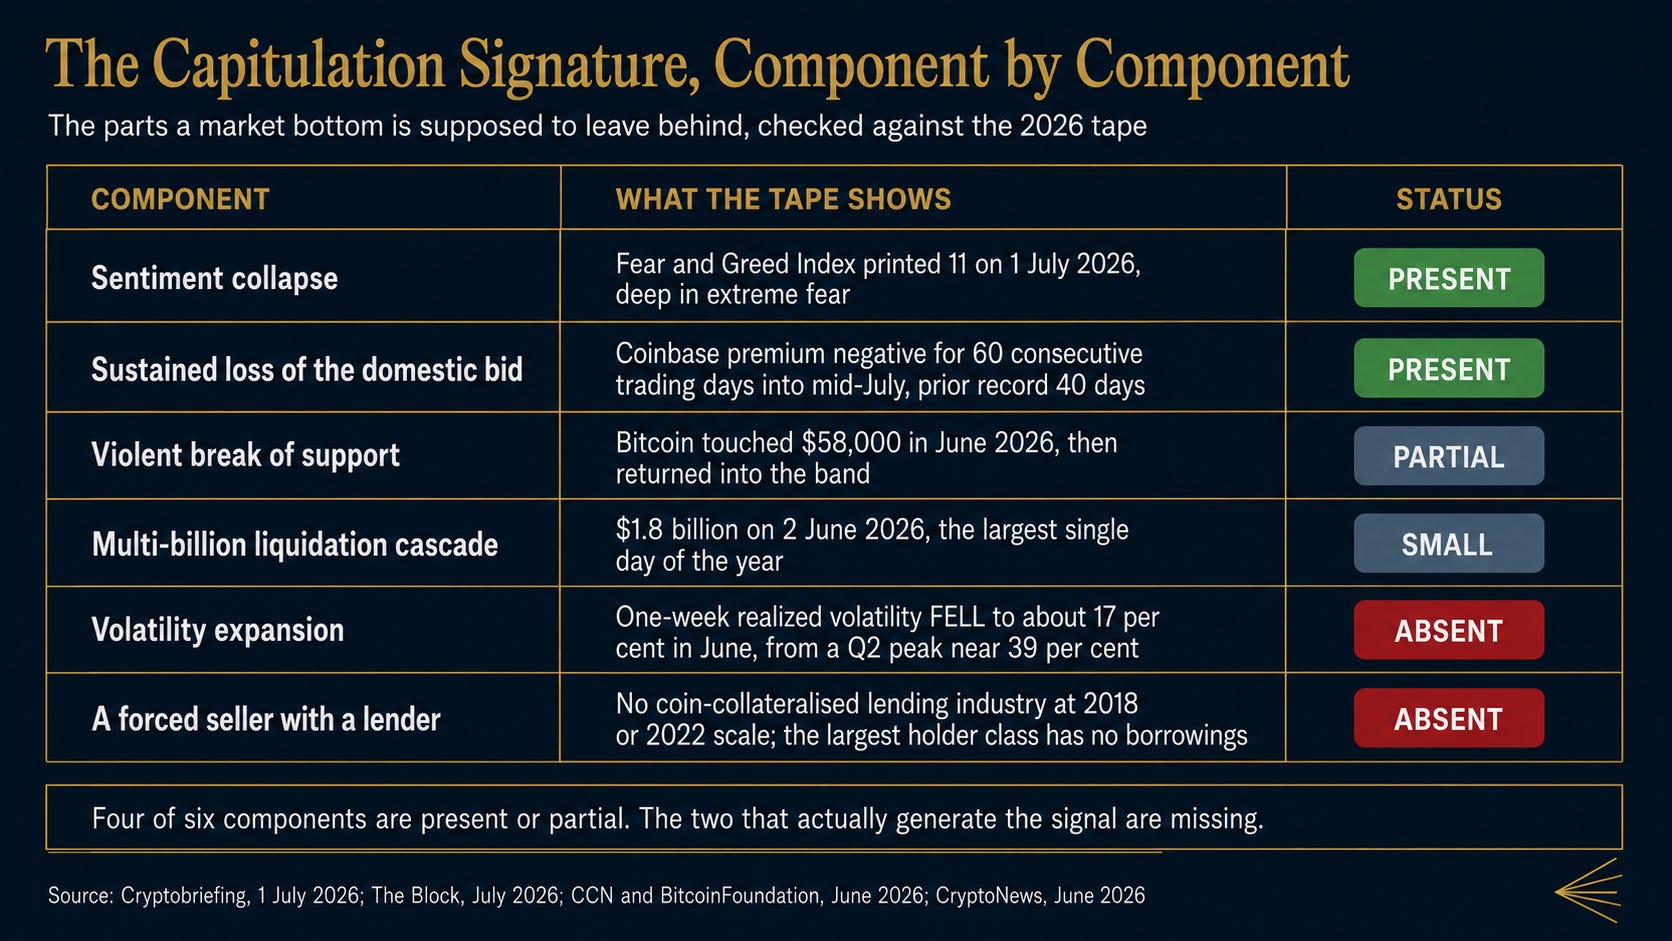
Halve the price of a volatile asset and its volatility is supposed to rise. This one’s fell. One-week realized volatility dropped to about 17 per cent in June, down more than half from the second-quarter peak near 39 per cent, and Bitcoin had already closed 2025 with realized daily volatility of 2.24 per cent, the lowest annual reading in its recorded history.
Ranges end in a recognisable way, and every experienced participant is waiting for it. Sentiment rots, leverage builds against a low that looks obvious, then something small pushes price through support and margin calls fire in sequence until a few hundred million dollars of forced selling becomes a few billion inside an hour. Price prints a long thin spike below everything and snaps back. Afterwards everybody points at the spike and calls it the bottom.
On 7 November 2022 that mechanism took Bitcoin down 22 per cent in less than a day as FTX failed, and the $20,000 to $30,000 waiting room emptied through a hole in a balance sheet.
The signature has one requirement. Somewhere in the system there has to be a seller who must sell, at any price, within minutes, because a lender has taken the decision away from them. Everything else in the cascade is downstream of that person, which makes the composition of the current selling worth laying out name by name and clock by clock.
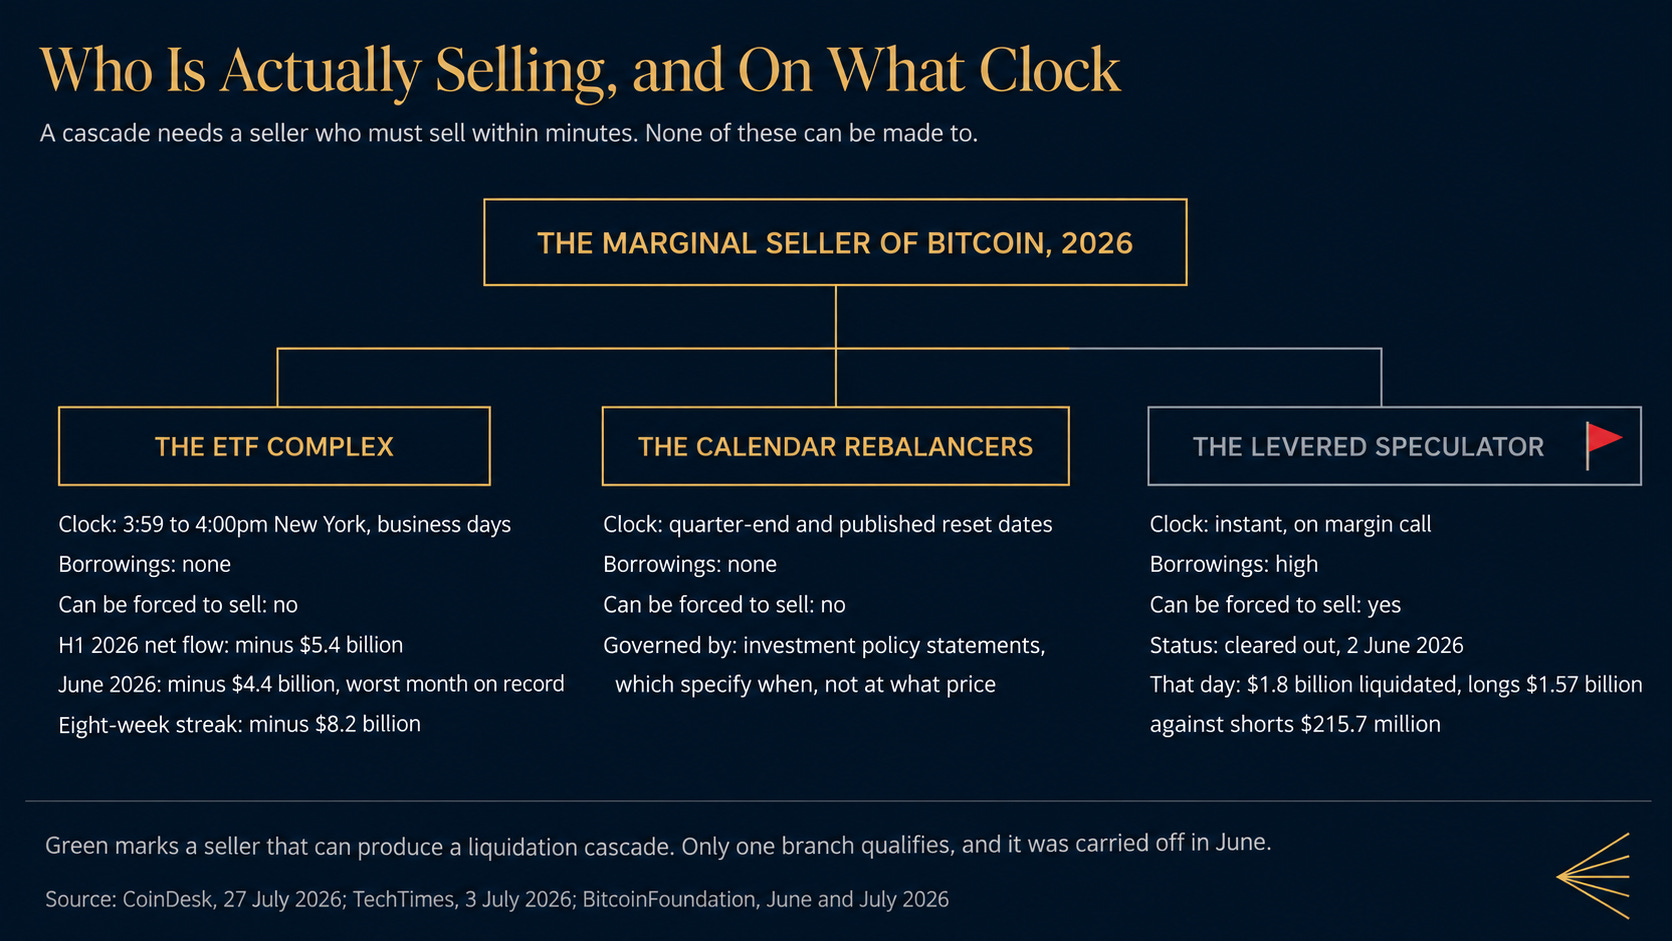
The largest seller is the ETF complex, and it has been selling hard. Net outflows across the US spot funds reached about $5.4 billion in the first six months of 2026, the first negative half since launch, and June alone took out roughly $4.4 billion, the worst month on record. One eight-week stretch drained more than $8.2 billion before it broke in mid-July. Those are real coins leaving real funds.
They leave on a schedule. A redemption is an instruction from a shareholder, aggregated overnight and executed in that four o’clock window. Nobody is margined, nobody receives a call at two in the morning, and the fund owes nobody money.
Behind the funds sit the calendar rebalancers: allocation committees that trim at quarter-end, model portfolios that reset on a published date, institutions whose investment policy statements specify when they act rather than at what price. They are the slowest sellers in finance and they are now among the largest.
The third class is the one that produces cascades, and it has already been through the wash. On 2 June about $1.8 billion of leveraged positions were liquidated in a single day, the largest wipeout of the year, with long liquidations of $1.57 billion against $215.7 million of shorts. Later that month another $1.26 billion went as Bitcoin touched $58,000.
So the roster is a very large seller with no lender and a very slow seller working from a diary. The one who makes cascades was carried off in June.
The sentiment leg of capitulation did arrive, and it arrived on its own. The Fear and Greed Index printed 11 on 1 July, about as frightened as that reading gets, then 21 on the third and 24 on the fifth. The Coinbase premium, which measures whether Americans are bidding harder than everyone else, stayed negative for 60 consecutive trading days into mid-July, demolishing the previous record of 40 days set in January and February.
Every available survey of feeling said the market had given up, and the price sat still. By 22 July that index had recovered to 53 and Bitcoin was above $66,600, its highest in a month, having gone nowhere in between.
Fear without forced selling is only an opinion.
Which has an awkward consequence for anyone holding this asset. A whole family of technical bottoming signals depends on a print that this market’s seller composition cannot produce. The long wick, the volume spike into support, the exhaustion candle: those are fossils left behind by margin clerks. Remove the margin clerk and the fossil never forms.
So suppose you are right, and the bottom of this range is the bottom. There will be no moment to point at, no candle to circle, no date that later acquires a name. The low will turn out, in retrospect, to have been an ordinary Tuesday in June when $1.26 billion of leverage went, the price stopped at $58,000, and nothing else happened.
Investment committees do not approve purchases on the strength of an ordinary Tuesday, and risk systems that need a volatility event to mark a regime change will not register one. A great many people are waiting for permission to buy, and the document they want is one this market has stopped issuing.
The Deep Dive
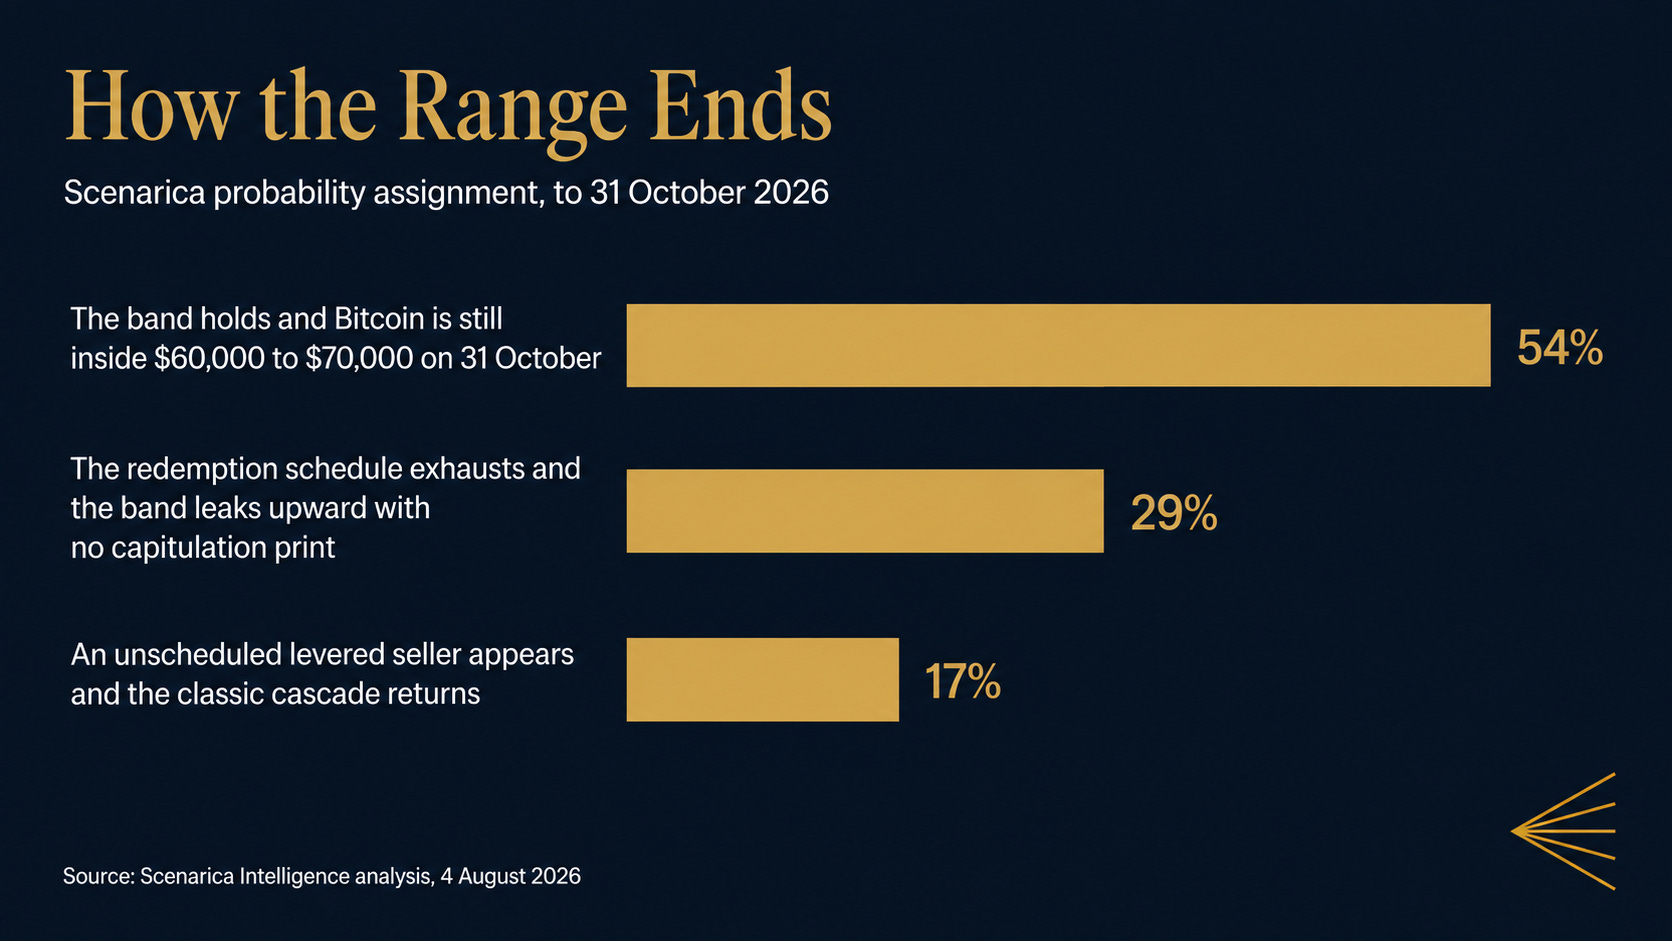
Fifty-four per cent says Bitcoin is still trading inside the sixty-to-seventy thousand band on 31 October, and the schedule is why. With three ways this ends, blind chance would put 33 per cent on each, so that is a claim of roughly one and a half times chance, and it is earned rather than assumed. The range has already absorbed the largest ETF redemption month in history and a record sixty-day stretch of negative American demand, and broke on neither.
Realized volatility at 17 per cent means there is no positioning built to break it, because the positions that break ranges are financed positions and the financing is gone. For the band to fail you need a seller with urgency, and every seller in the system is working from a diary. If you hold Bitcoin, the practical translation is that your next three months are more likely to be boring than painful, and boredom carries a cost you should price separately from drawdown.
The second ending, worth 29 per cent, is the one the mechanism itself points toward, and it is quieter than a rally is supposed to be. The schedule simply runs out. ETF flows have already turned: the eight-week outflow streak broke in mid-July, three consecutive weeks of net creations followed, and the week to 24 July closed at plus $33.8 million even after redemptions of $225.2 million and $240.1 million on the twenty-third and twenty-fourth.
That recovery has clawed back only around 15 per cent of June’s losses, which is why it does not lead. If the turn survives the autumn, though, the band leaks upward rather than breaking, without volume signature and without a candle worth naming, and the people waiting for confirmation will still be waiting at $80,000.
Then there is the seller who is on nobody’s calendar. Somewhere outside the fund wrapper sits a levered holder with a lender, and if that lender moves, the old signature returns in full: a hole through $58,000, several billion in liquidations, and finally the candle everyone has been waiting to circle. This is how both of the longer ranges resolved, which makes 17 per cent an unusually low assignment against the historical base rate.
The justification is structural rather than hopeful. Each prior waiting room contained a large coin-collateralised lending industry, and Celsius, Three Arrows, Genesis and FTX were all in the business of financing coin against coin. Nothing at that scale exists today, and the largest holder class in the market cannot be margin called because nobody lent it anything. A credit event still requires credit.
The redemption itself changed shape thirteen months ago, and that change is the gearing underneath everything else.
Until the summer of 2025, US spot Bitcoin ETFs redeemed in cash only. A shareholder sold, the authorised participant handed back shares, and the trust went into the spot market and sold bitcoin to raise dollars. That trust was a price-insensitive seller with a settlement deadline, which is very close to the profile of a margin clerk. On 29 July 2025 the SEC approved in-kind creation and redemption for digital asset exchange-traded products, and the funds converted.
Under in-kind, the trust sells nothing. It delivers coins to the authorised participant, a large broker-dealer with a balance sheet, and the question of when and whether those coins are sold becomes that firm’s inventory problem. The AP can work the position into the bid across several days, hedge in futures and hold the spot, or warehouse the coins against creations it expects later in the week. A redemption that used to be a market order became a transfer of title.
This is why the largest outflow stretch ever recorded produced no volatility event. More than $8.2 billion left over eight weeks and one-week realized volatility went down while it happened. Under the old mechanism, that much forced spot selling into post-cascade liquidity would have printed something violent. Under the new one, the identical flow arrives as a sequence of negotiated inventory decisions taken by firms whose entire competitive advantage lies in not moving the price when they trade.
The flow does not disappear, it migrates. Redemption pressure that once hit the spot tape now shows up as hedging in futures and options, as a persistent offer in the basis, and as the grinding low-amplitude drift that has characterised the whole year. The selling is the same size, and it arrives administered.
Set this range beside the only two that have lasted longer and the divergence is easy to see.
The $10,000 to $20,000 band absorbed most of 2018 and ended in a break toward $3,200 that November and December, driven by forced deleveraging among miners and early leveraged holders. The $20,000 to $30,000 band absorbed most of 2022 and ended in two stages: Terra and Three Arrows in June, then FTX in November, which removed 22 per cent between the seventh and the eighth and left a low everyone can still name to the day.
Both waiting rooms were emptied by the same instrument, a lender calling a loan. Each sat on top of a large, opaque, coin-collateralised lending industry, and when that industry impaired, the collateral had to be sold into whatever bid existed. The wick was the shape of a liquidation, not the shape of despair.
The parallel breaks at the holder. The dominant owner of the marginal coin today is a fund with no borrowings, whose investors carry the loss directly on their own statements, and no third party has any mechanism to force their hand. IBIT alone holds roughly 774,000 bitcoin, close to 3.7 per cent of everything that exists, and none of it is pledged against anything.
Where the parallel does not break is what keeps that third scenario alive. Leverage did not leave the asset, it changed address, and it now sits on corporate balance sheets that borrowed to buy coin, with published holdings and published debt-service dates. Whether that cohort becomes a forced seller is answered from filings rather than from the tape, and it is the one remaining place where the old signature could still be manufactured.
Which raises what holds the range down at the top, because a floor defended by an absence explains only half the box.
Bitfinex analysts put the average acquisition price of everyone who bought Bitcoin across the five months to late July at roughly $68,000, and Glassnode’s 307 days inside the band says the same thing from another angle: more coins have changed hands at these prices than at almost any other level in Bitcoin’s history, which places the largest cost-basis cluster in existence directly overhead. That cluster is a seller too, and its schedule is psychological rather than contractual. It sells at breakeven. Every approach toward $68,000 meets a wall of people who have been underwater for five months and want out at cost, and the 50-month exponential moving average, flipped from support to resistance in the mid-$65,000s, gives that wall a technical address systematic strategies will defend as well.
So the geometry is a floor held up by an absence and a ceiling held down by a presence. Nobody can be forced to sell into the low, and a very large cohort has already decided to sell into the high. The probabilities concentrate because both walls are made from things that move slowly: the floor cannot fail without new credit entering the system, and the ceiling cannot fail until the overhead supply is absorbed, which is a function of net creations, which is a function of the calendar.
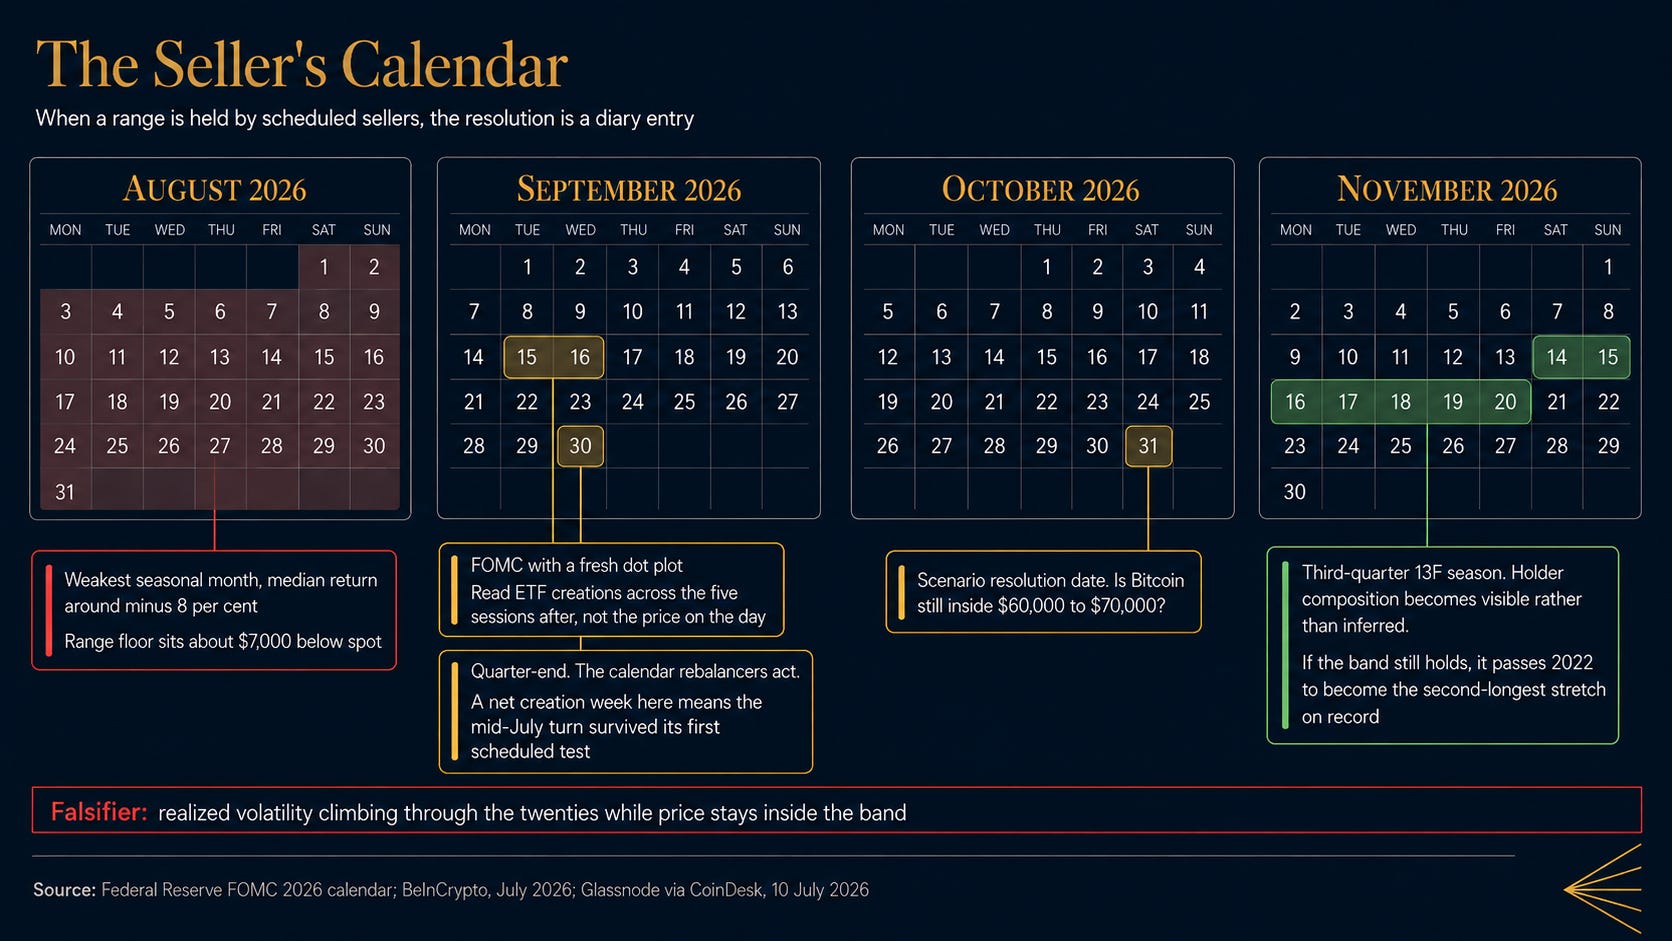
August is the weak month, with a median return of roughly minus 8 per cent and the range floor about seven thousand dollars below spot. A drift toward the low sixties with realized volatility still in the teens confirms everything here. The same drift with realized volatility climbing through the twenties while price stays inside the band would falsify it, because expanding volatility inside a range means somebody has started taking positions that need financing.
The FOMC meets on 15 and 16 September with a fresh dot plot, and the relevance is not directional. A meaningful cut changes the pace at which the scheduled buyer arrives, which fires the quiet upward leak rather than the break, so read ETF creations across the five sessions afterwards rather than the price on the day.
Quarter-end falls on 30 September, when the calendar rebalancers act. A net creation week across it means the mid-July turn has survived its first scheduled test and the second scenario gains real ground. A negative quarter-end print resets the redemption clock and extends the range into the winter.
Mid-November brings third-quarter 13F season, when the composition of the holder base becomes visible rather than inferred. Advisory and pension channels adding while fast money exits would mean the schedule is lengthening, and a lengthening schedule is a longer range. Somewhere inside that same window, if the band holds, it passes 2022 and becomes the second-longest stretch Bitcoin has ever spent inside ten thousand dollars.
The people waiting for capitulation are waiting for a receipt. In 2018 and again in 2022 a lender wrote one. This time the coins leave through a window that shuts at four o’clock, in orderly baskets of twenty-two, and the bottom will be identified in arrears by somebody with a spreadsheet, long after the price at which it could have been bought.
Sources:
CoinDesk, “Bitcoin’s $60K to $70K range becomes third longest consolidation in history,” 10 July 2026 (Glassnode data).
CoinDesk, “Bitcoin ETFs record third consecutive weekly inflows despite losses of $465 million to end week,” 27 July 2026.
The Block, “Bitcoin slides toward $63,000 as Coinbase premium stays negative for a record 60 days,” July 2026.
CryptoTimes, “Bitcoin Price Rebounds Amid Persistent ETF Outflows and Compressed Volatility,” 2 July 2026.
Bitcoin Magazine, “Bitcoin Price Volatility Hits Record Lows,” 2026.
CryptoNews, “Bitcoin realized volatility falls to just 17%,” June 2026.
TechTimes, “Bitcoin ETF Outflow Streak Ends at $2.7B as June Jobs Data Cools Rate Risk,” 3 July 2026.
BitcoinFoundation, “Bitcoin ETFs Post Record Week of Outflows: $8.2B Leaked,” July 2026.
BitcoinFoundation, “Crypto Liquidations Surge Near $1.8B as BTC Longs Get Crushed,” June 2026.
CCN, “Bitcoin Price Falls to $58K as $1.26B Liquidated,” June 2026.
Cryptobriefing, “Crypto Fear & Greed Index drops to 11, signaling extreme fear,” 1 July 2026.
BitDegree, Live Crypto Fear and Greed Index, 22 July 2026.
CoinDesk, “FTX Collapse Leaves Total Crypto Market Cap Under $800B, Close to 2022 Low,” 17 November 2022.
Dechert LLP, “SEC Approves In-Kind Creations and Redemptions for Crypto Asset ETPs,” August 2025.
CryptoSlate, “IBIT flips to in-kind creations: what it means for spreads, taxes and flows,” 2026.
TradingKey, “Bitcoin at $65K vs. October’s $126K All-Time High,” July 2026.
BeInCrypto, “Bitcoin Price Prediction for August 2026,” July 2026 (August seasonality).
Federal Reserve, FOMC 2026 meeting calendar.
Disclaimer: This report is published by Scenarica Intelligence for informational purposes only. It does not constitute investment advice, a solicitation to buy or sell any financial instrument, or a recommendation regarding any particular investment strategy. Scenarica Intelligence is not a registered investment adviser or broker-dealer. All scenario probabilities and assessments represent the analytical judgment of Scenarica Intelligence and are subject to change without notice. Past performance of any asset or strategy discussed does not guarantee future results. Readers should conduct their own due diligence and consult with qualified financial advisers before making investment decisions.
Scenarica Premium: The full Scenarica suite includes Geopolitics, Economy, Bitcoin, AI, and Sunday Edition.
Scenarica Intelligence
We don’t predict the future. We price it.