



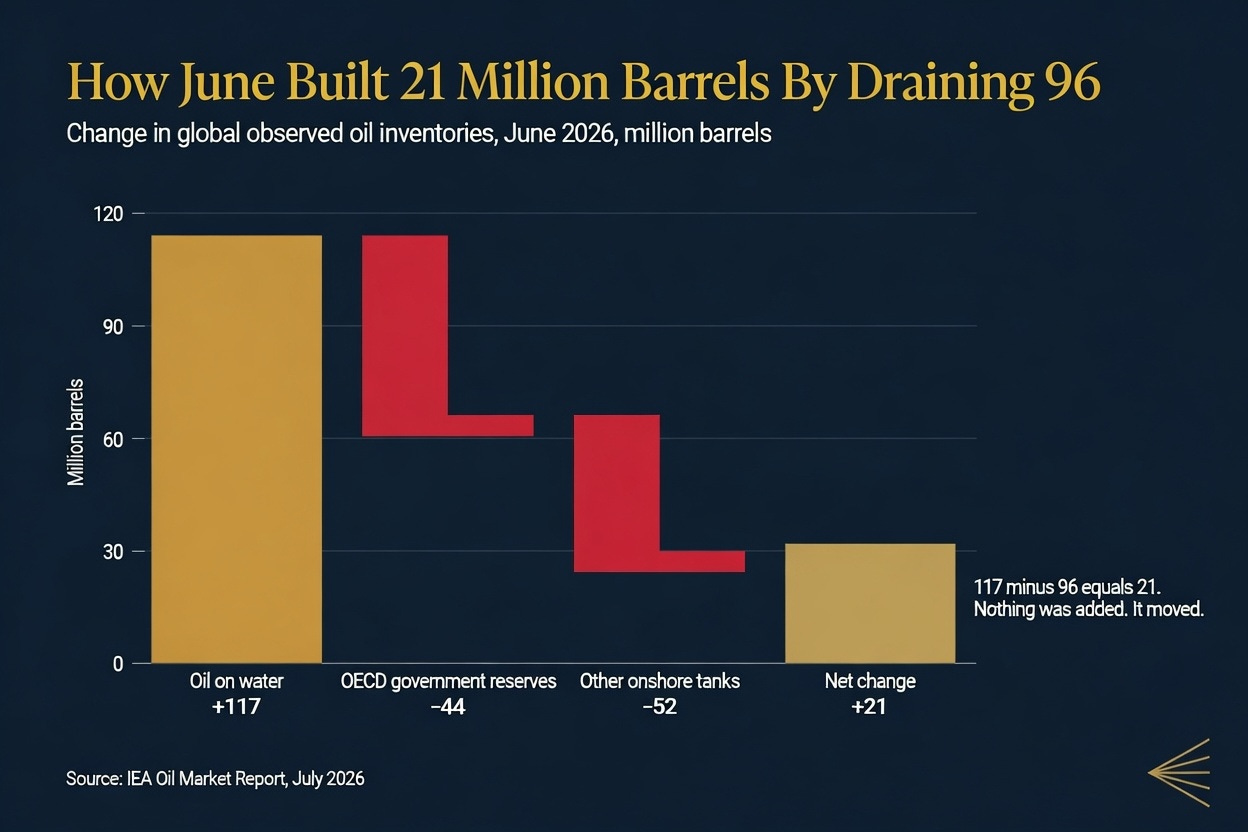
Global oil inventories rose by 21 million barrels in June. It was the first build in four months, it followed a spring in which the world drew down its reserves faster than at any point in the modern record, and it was received almost everywhere as the first sign that the worst had passed.
The rest of the sum is in the same report. Onshore tanks fell by roughly 96 million barrels over the month, of which 44 million came out of government emergency reserves. Oil sitting on ships rose by 117 million.
One hundred and seventeen minus ninety-six is twenty-one.
Every barrel of that build, and rather more besides, was oil that had left the land and gone to sea, which is a different event from oil arriving.
Where it moved to, and why, is the whole of the story. The Strait of Hormuz has been running at a fraction of its normal traffic since the spring. When the interim ceasefire held in June, the tankers that had been waiting rushed out, and total Gulf oil exports jumped by 6.5 million barrels a day to 16.1 million, against a pre-war average near 24 million. That armada then had to sail somewhere. Refining hubs that used to be three weeks away were suddenly a great deal further, because the second door had begun closing behind the first.
On 20 July the Houthis declared that vessels calling at Saudi ports would be treated as targets anywhere within their reach. Three days later two tankers were attacked in the Red Sea and one was set ablaze. By 26 July, eleven commodity vessels passed through the Bab el-Mandeb in a full day, seven of them oil tankers, the lowest count in months. On the other side of the peninsula, three vessels transited Hormuz on 21 July. No very large crude carriers among them, and no LNG.
Simultaneous degradation of two chokepoints has no modern precedent, and it produces an effect the inventory statistics were never built to describe.
Kpler puts the direct voyage from Yanbu on the Red Sea coast to South Korea at about 24 days. Send the same cargo north through Suez, into the Mediterranean, and then the long way around the Cape of Good Hope, and it becomes roughly 54 days.
Oil in transit is the product of two numbers: how much moves each day, and how long each barrel spends moving. Hold the first steady and stretch the second, and the count of oil in the system rises without a single additional barrel being lifted out of the ground.
About six million barrels a day of crude pass the Bab el-Mandeb bound for Asia, two thirds of it Saudi. Take four million barrels a day and give each barrel thirty extra days at sea. The result is 120 million barrels.
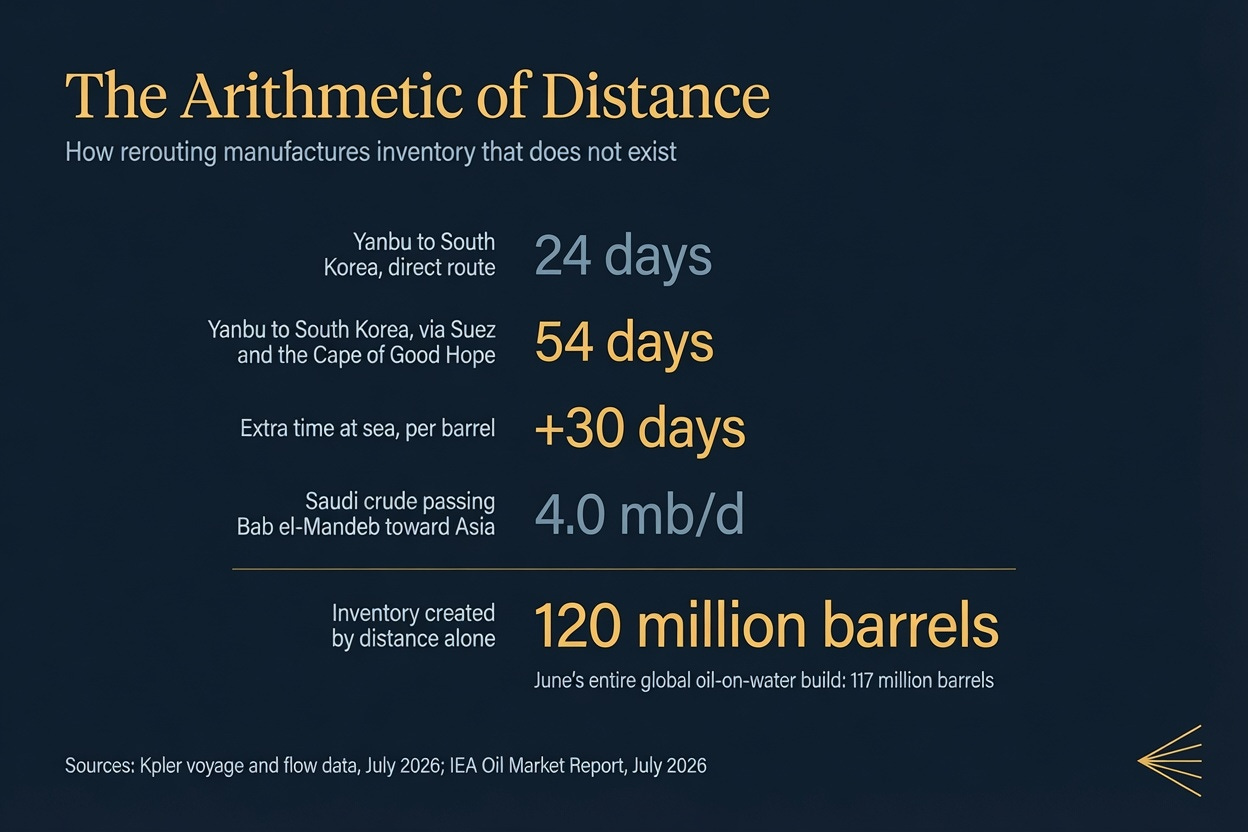
It is geography, denominated in barrels, and it contains no oil that did not already exist. It is also very slightly larger than the entire oil-on-water build that made June look like a turning point.
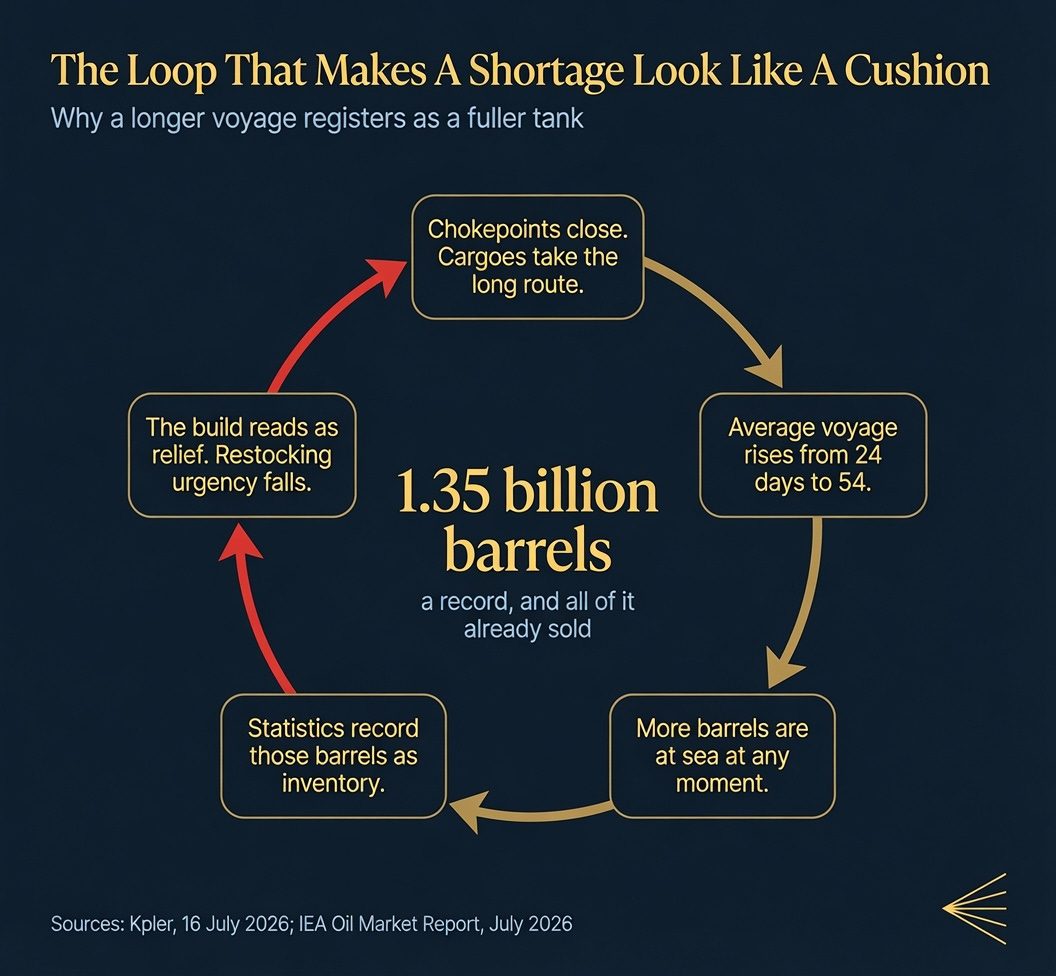
The world measures its oil buffer in barrels. Time is what binds it. When routes lengthen, those two measures move in opposite directions: the barrel count climbs while the days of usable cover fall, and the statistic designed to warn you improves precisely as the thing it describes gets worse.
A sceptic has a fair objection ready. Barrels at sea are still barrels. They arrive eventually. Thirteen days of world demand is floating out there, a record 1.35 billion barrels by Kpler’s count in mid-July, well above the 1.33 billion peak of late 2025. Surely a cushion that large is a cushion.
Kpler answered that in the same note. Floating storage, meaning ships that sit still, has been falling. The barrels are moving, which is to say they have already been sold. A cargo in transit is not a reserve. It is a delivery obligation with a name and a date attached, and the buyer at the other end has already priced it. Roughly half the 1.35 billion is identified as Asia-bound, and once the Russian and Iranian volumes with undeclared destinations are allocated, Kpler estimates Asia absorbs closer to seventy per cent.
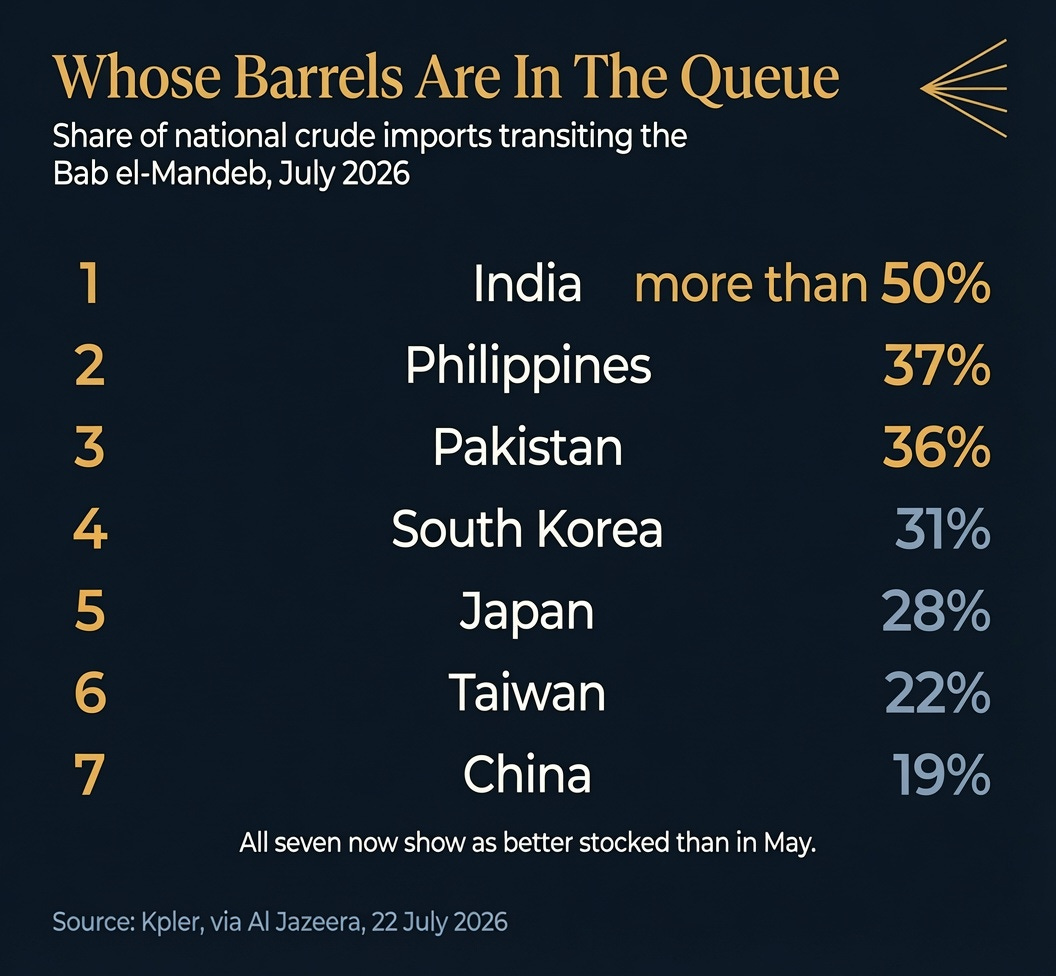
So the queue has owners, and the owners are concentrated. India takes more than half its crude through the Bab el-Mandeb. The Philippines takes 37 per cent, Pakistan 36, South Korea 31, Japan 28, Taiwan 22, China 19. Every one of those countries has just had its supply line lengthened by weeks, and every one of them shows up in the global statistics as better stocked than it was in May.
Saudi Arabia has managed the routing problem with considerable skill, moving about 4.1 million barrels a day out of Yanbu in June and redirecting roughly 64 per cent of the crude that would ordinarily have gone through Hormuz. The barrels leave. That was never the constraint. The constraint sits in the water between the loading arm and the refinery gate, and it has grown by a month.
A queue is what a shortage looks like while it is still being counted.
The Deep Dive
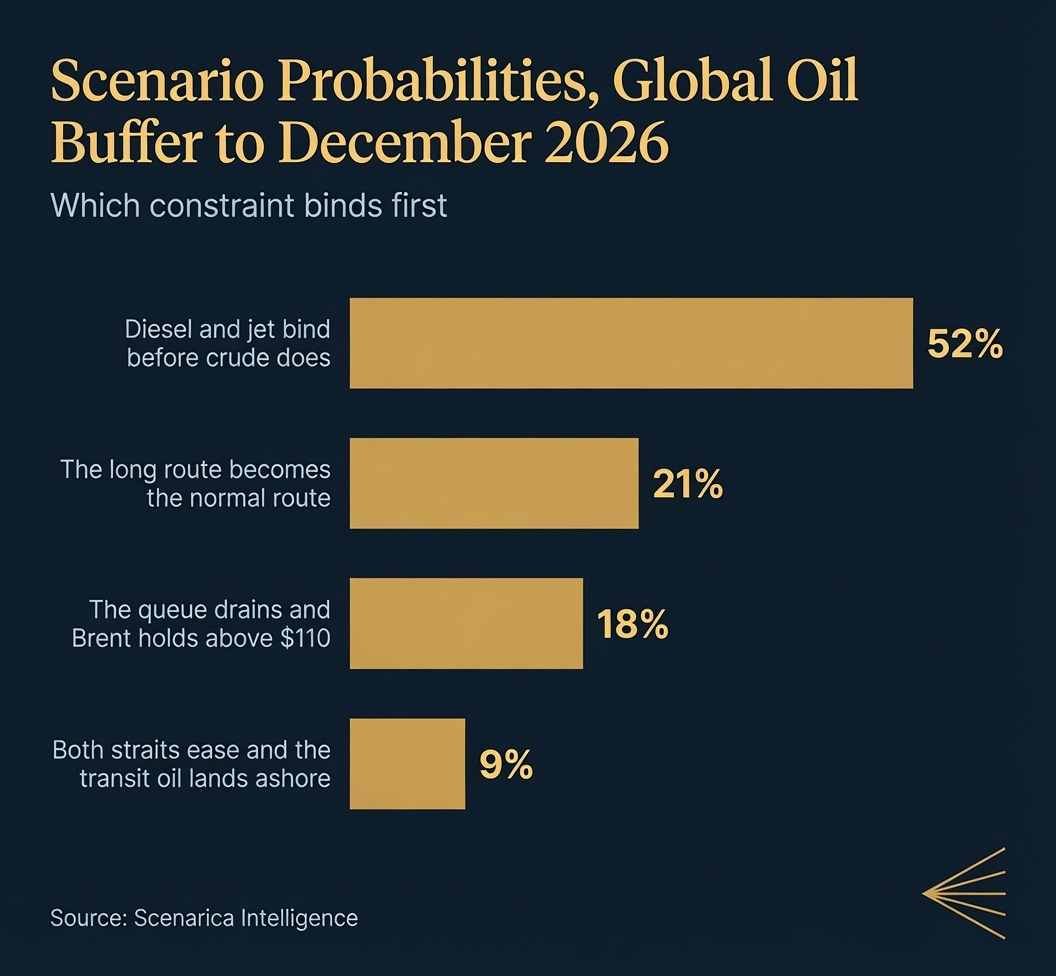
Fifty-two per cent of the weight belongs to an outcome that the crude price will not show you: the binding constraint between now and December arrives in refined products, not in barrels of oil. If you are hedging fuel cost rather than crude, that is the scenario that reaches you first, and the market is currently spending its attention on the wrong contract.
There is a second world in which nothing new breaks and the long way around simply becomes the normal way around, oil on water holding above 1.3 billion barrels into the winter while onshore tanks grind lower a few million at a time. Call that 21 per cent. Should Gulf exports stay near the 4.5 million barrels a day Kpler measured over the ten days to 16 July, rather than the 12.5 million of early July, the queue drains rather than lengthens and crude itself becomes the constraint, with Brent holding above $110 for a sustained stretch. That path carries 18 per cent. And in the world the consensus is still modelling, both chokepoints ease enough for the reroute to unwind, the transit inventory lands ashore all at once, and the market discovers it has a genuine glut. Nine per cent.
A tanker is a machine that performs a fixed number of deliveries per year, and that number is set by voyage length. On the direct Yanbu run to Northeast Asia, twenty-four days out and a similar interval back, plus loading, discharge and positioning, a very large crude carrier completes something close to seven laden voyages in a year. Route the same ship through Suez and around the Cape at fifty-four days out, and it manages roughly three.
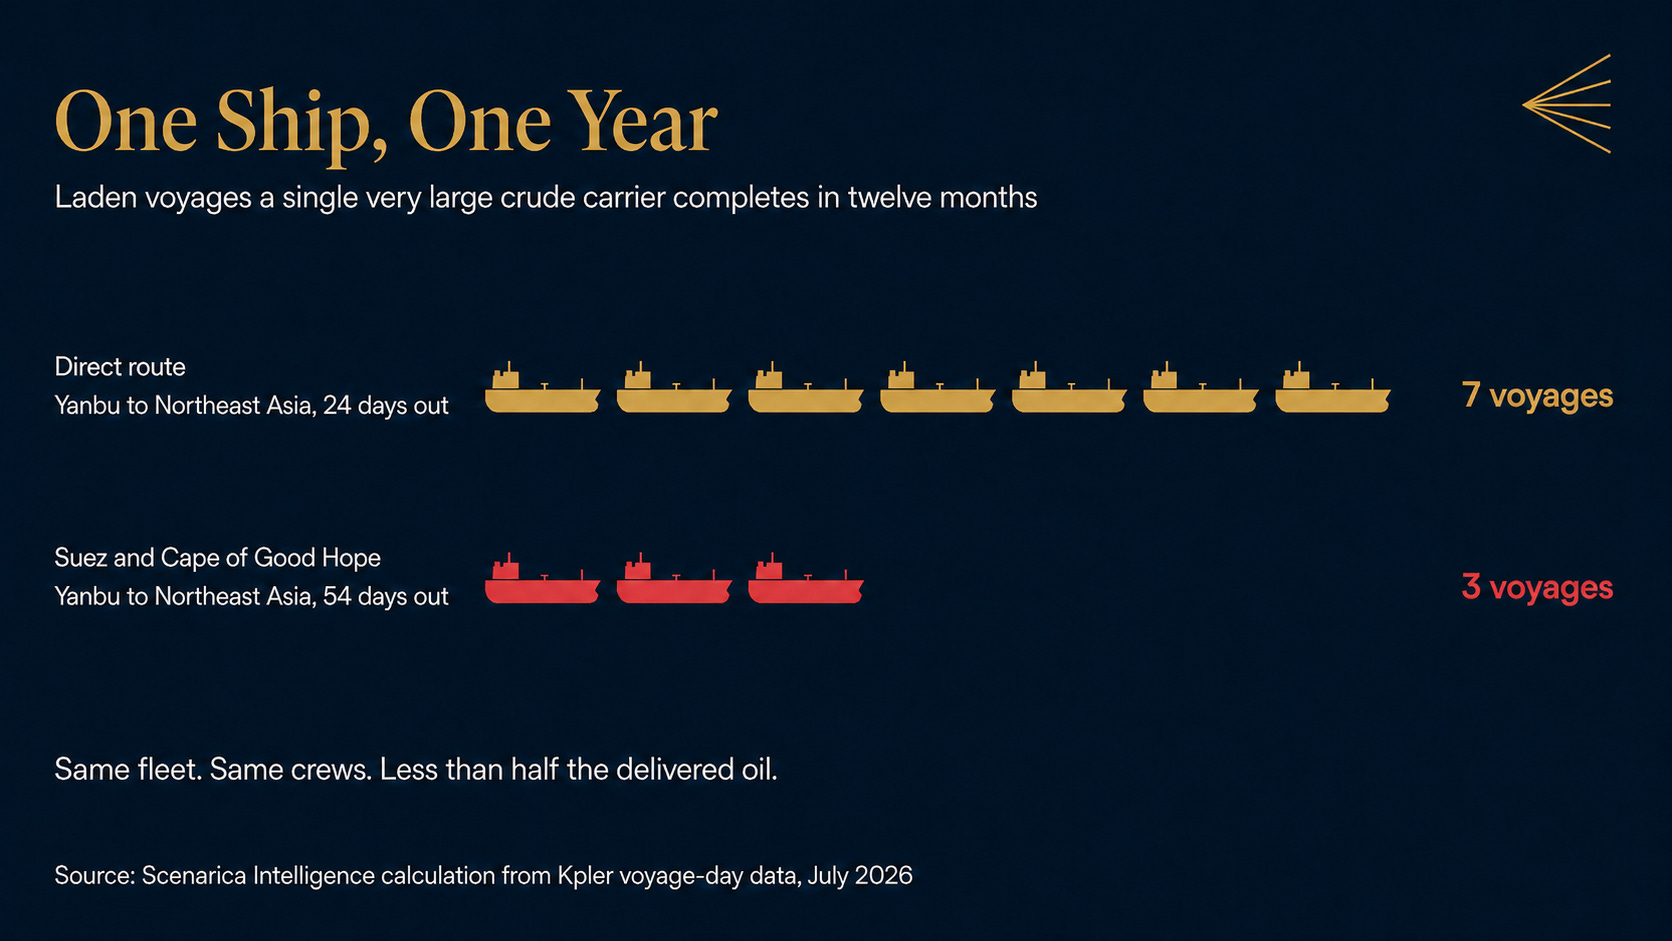
Read that as a change in the size of the fleet rather than a change in the price of freight. Every ship pushed onto the long route removes better than half its annual carrying capacity from the market while remaining fully employed, which is why the world can simultaneously hold a record volume of oil at sea and find it harder to get a cargo where it needs to go. The Baltic index for the benchmark Middle East Gulf to China run was assessed at Worldscale 372 in late July, a round-trip time-charter equivalent near $368,900 a day, against roughly $286,500 on 3 July. Freight is doing what the crude price is not, because freight prices ton-miles and crude prices barrels, and the shortage this quarter is in ton-miles.
There is a further wrinkle that will not clear quickly. Most Yanbu liftings go onto very large crude carriers, and a fully laden VLCC cannot transit the Suez Canal, which means either part-discharging into Egypt’s SUMED pipeline or switching to smaller Suezmax tonnage. Kpler’s Homayoun Falakshahi has been explicit that maintaining export rates on that route would require a material shift toward Suezmax liftings or additional lightering, and that logistics, not oil, is the bottleneck. Every one of those adaptations consumes more days and more ships.
So the fleet is effectively smaller, the voyages are longer, and the inventory statistic records the whole degradation as an improvement. Now consider what that does to products, because that is where the distribution’s weight sits.
Crude has a queue. Refined products largely do not.
The 1.35 billion barrels on the water are overwhelmingly crude and condensate, moving from producers to refineries. Diesel, jet and gasoline travel shorter distances on smaller ships with tighter turnaround, and the buffer between a refinery and a fuel terminal is measured in days rather than weeks. When crude supply is disrupted, the transit pool absorbs some of the shock and delays the arrival of the pain. When refining is disrupted, nothing absorbs it.
Refining is disrupted in three theatres at once. Gulf exports of refined products and LPG in June ran at less than half their pre-war level while crude flows recovered to nearly three quarters, because the region’s export refineries had not resumed loading. Ukrainian drone attacks have continued against Russian downstream infrastructure through the summer, and Moscow has responded by restricting exports of gasoline, jet and diesel to protect domestic supply. In the United States, refineries were running at 96.1 per cent of operable capacity in the week to 17 July, which is to say there is no slack left to call on.
The prices have already told you which market is short. The prompt NYMEX 3-2-1 crack spread hit a record $64.58 a barrel on 8 July. European diesel margins passed $60 a barrel, also a record, after Russia moved to halt diesel exports. US distillate stocks, even after a 1.4 million barrel weekly build, sat about 10 per cent below the five-year average in the week to 17 July, while commercial crude at 411.7 million barrels was about 6 per cent below. Retail diesel in the United States reached $5.134 a gallon on 20 July. Crude, over the same period, spent its time swinging between $68 and $101 and settling in the high nineties.
That gap is the trade and the warning together. A reader watching Brent for evidence of scarcity is watching the market that has 1.35 billion barrels of shock absorber in front of it. The market without the absorber is printing records weekly and has been doing so since early July.
The buffer designed for exactly this situation has been the first thing spent. OECD government inventories have fallen by 163 million barrels since the conflict began, taking them to their lowest level since December 1990, below where they stood during the Gulf War. The US Strategic Petroleum Reserve was drawn down another 5.1 million barrels in a single week to 311.4 million. Commercial stocks, over the same stretch, sit only modestly below their five-year norms. The normal shape of an oil crisis is that private inventory is drained while public inventory is held back for the moment it is most needed. That shape is now inverted, and the instrument built in 1974 for a supply emergency was largely consumed on the first chokepoint, before the second one opened.
The objection is real and it deserves its due. The IEA’s collective action of 11 March authorised 400 million barrels, the largest in the agency’s history and only its sixth since 1974, and as of 12 June about 252 million of that had reached the market. Something on the order of 148 million barrels of authorised release remained undelivered. On that reading the public buffer is not exhausted at all. It is loaded and waiting, and any account that treats it as spent is overstating the case.
The objection modifies the conclusion rather than defeating it, and the reason is the same arithmetic that runs through this whole piece. An authorised barrel is not a delivered barrel. It has to be lifted, loaded, and sailed, and it sails on the same water as everything else. A reserve release into a system where the average voyage has gone from twenty-four days to fifty-four does not arrive when it is announced. It arrives when it arrives, and the announcement is what moves the price while the cargo is still at sea. The narrower formulation is the defensible one: the public buffer retains real firepower, and its rate of fire has been cut by the same mechanism that inflated the inventory count, so a government deciding on a Monday in August to put emergency barrels into an Asian market is promising something for the back half of September.
That is the case for a 52 per cent leader. Product stress requires no new event, no further escalation and no fresh decision by anyone. It requires only that the current configuration persist, and the current configuration has already produced record cracks with refining capacity impaired in three regions and no spare utilisation anywhere. What holds it under sixty is that a genuine demand recovery is underway from May’s 97.9 million barrel a day trough, refiners have every incentive at these margins to push runs wherever runs are physically possible, and governments confronted with diesel at these prices tend to intervene in ways that dull the signal.
The nine per cent on a clean resolution is not a rounding error but it is a demanding path. It needs both Hormuz and the Bab el-Mandeb to normalise inside five months, when the first has been degraded since the spring, has already broken one ceasefire, and the second has been closing since 20 July. The EIA’s July outlook, published on 7 July, forecast Brent averaging $70 in the fourth quarter and stocks building at 2.7 million barrels a day. That forecast was made thirteen days before the Houthi declaration and sixteen before the tankers were struck.
And the 18 per cent on crude itself binding sits below where blind chance would put it, which requires saying why. The reasons are physical. There are 1.35 billion barrels already floating and already sold, roughly 21 million barrels of unsanctioned Middle Eastern crude idling in Asian waters for more than a week, and a Chinese buyer that took only 6.2 million barrels a day of seaborne crude in June, the lowest since November 2015, and around 7.8 million in July, still 41 per cent below a year earlier. A buyer running at a decade low has slack. Until that slack is used, prompt crude has somewhere to come from.
Watch the calendar rather than the headlines. On 5 August the EIA publishes the first Short-Term Energy Outlook written with the Red Sea declaration in front of it; if the 2.7 million barrel a day fourth-quarter build survives contact with the new routing, the agency is betting on the reroute unwinding. Through August, each Wednesday’s US distillate print is the cleanest read on the leading scenario, and a move below roughly 105 million barrels while cracks hold at records would confirm it outright. Around 13 August the IEA’s monthly report carries the oil-on-water line, and a second month of the June pattern, on-water rising while onshore falls, means the queue is still lengthening rather than clearing. In early September, Chinese customs data for August will show whether the world’s largest buyer has begun restocking into a market whose public cushion is at a thirty-five-year low. And through the fourth quarter, Kpler’s barrels-on-water series is the single number worth a standing alert: a sustained fall below 1.2 billion while Gulf exports stay near 4.5 million barrels a day is the queue draining, not the queue clearing, and those two look identical in the data for about three weeks.
Every buffer in the global economy is counted the way this one is, as a quantity held rather than a distance still to travel. Grain, chips, pharmaceuticals, ammunition. The count works as long as the map stays the same shape. Redraw the routes and the same statistic keeps reporting, with perfect accuracy, on a world that no longer exists. In June the world’s oil buffer grew by 21 million barrels, and every one of them was at sea, sold, and a month further away than it used to be.
Sources:
International Energy Agency, “Oil Market Report - July 2026,” 10 July 2026.
International Energy Agency, “Oil Market Report - June 2026,” 17 June 2026.
International Energy Agency, “IEA Member countries to carry out largest ever oil stock release amid market disruptions from Middle East conflict,” 11 March 2026.
International Energy Agency, “Update on IEA collective action decision of 11 March 2026,” June 2026.
Kpler, Homayoun Falakshahi, “Record oil-on-water volumes limit the next leg higher in crude,” 16 July 2026.
Al Jazeera, Caolan Magee, “Can the Suez save Asian oil consumers after Houthis shut Bab al-Mandeb?” 22 July 2026, citing Kpler voyage-day, routing and import-share data.
Al Jazeera, “As oil soars, experts watch Red Sea tankers for clarity on Houthi blockade,” 24 July 2026.
The Epoch Times, “Red Sea Crude Shipping Slows Amid Houthi-Saudi Tensions,” 27 July 2026, citing Kpler transit counts for 26 July 2026.
US Energy Information Administration, “Weekly Petroleum Status Report,” data for week ending 17 July 2026, released 22 July 2026.
US Energy Information Administration, “Short-Term Energy Outlook,” 7 July 2026.
Baltic Exchange, TD3C route assessments, 3 July 2026 and late July 2026.
Forbes, Garth Friesen, “Refining Stocks Soar As Crack Spread Hits Record High In 2026,” 23 July 2026.
Bloomberg, “China’s Crude Imports in July Set to Rise From Decade Low,” 27 July 2026.
Bloomberg, “China’s Crude Oil Imports Plunge to Lowest in Nearly a Decade,” 14 July 2026.
Disclaimer: This report is published by Scenarica Intelligence for informational purposes only. It does not constitute investment advice, a solicitation to buy or sell any financial instrument, or a recommendation regarding any particular investment strategy. Scenarica Intelligence is not a registered investment adviser or broker-dealer. All scenario probabilities and assessments represent the analytical judgment of Scenarica Intelligence and are subject to change without notice. Past performance of any asset or strategy discussed does not guarantee future results. Readers should conduct their own due diligence and consult with qualified financial advisers before making investment decisions.
Scenarica Premium: The full Scenarica suite includes Geopolitics, Economy, Bitcoin, AI, and Sunday Edition.
Scenarica Intelligence
We don’t predict the future. We price it.